More work
3D fun #
Playing around with React Three Fiber and leva GUI. I've also had a chance recently to do more UI explorations with ThreeJS, React3Fiber, and GLSL shaders, but can't share that work currently.
Figma plugins #
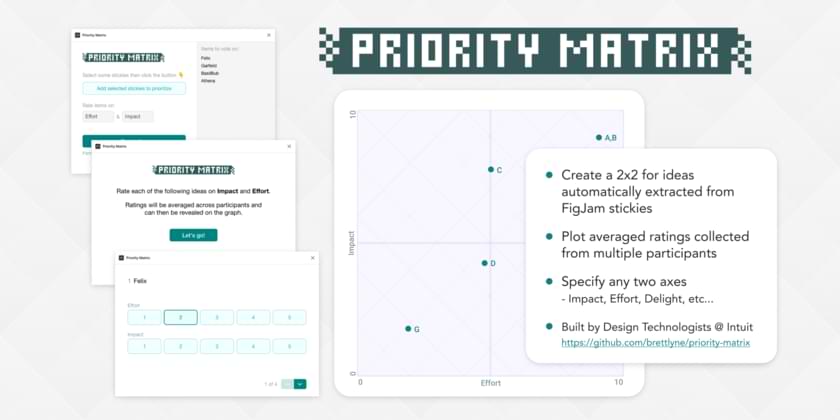
Priority Matrix – FigJam Plugin #
While on paternity leave with my second daughter I had the chance to experiment with the brand-new FigJam widget API. I created Priority Matrix, which lets a group vote independently on a set of ideas on two axes, then reveal the averaged votes to review as a group. The default axes are "effort" and "impact".
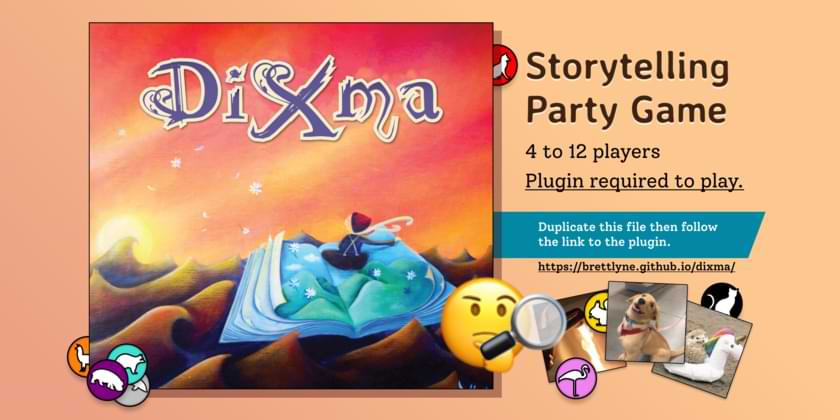
Dixma – Figma Plugin #
This one was a team effort and the first Figma plugin we ever worked on! Dixma is a multiplayer game with gameplay borrowed from Dixit, content stolen from memes, and multiplayer capabilities questionably forced to work via a Figma plugin. While the game was buggy, it was also fun to play and a great way to try something new.
Misc animation code #
Animation is an area where very few frontend devs at Intuit have specialized, so there have been a ton of opportunities over the years to help teams ship performant animations.
Steps to animate the Intuit loading spinner with CSS #
The original version of this loading spinner was built using gsap, and a later CSS version animated the stroke-dashoffset with some inconsistency across browsers.
This codepen breaks down the steps to create the Intuit indeterminate loading spinner using only performant transform animations.
Comparison of shipping animations as gif / mp4 / lottie #
Despite repeatedly asking teams not to use gifs to ship animations, we still get requests for gifs to this day since some content management systems don't offer built-in support for video or lottie files.
This 2018 project started as an ask to create some simple animations for a marketing page, but they were also useful to highlight the benefits of using lottie to ship animations.
https://brettlyne.github.io/animations-size-comparisons/ - scroll down the page for the comparison of animation delivery options
Lottie bundle size #
As teams were beginning to adopt Lottie across Intuit to ship SVG animations created in After Effects, one source of resistance was adding 60kb to the core bundle across our products. I admittedly did fairly little here, but the work had a big impact since it paved the path for lottie, which is now used extensively across QuickBooks and TurboTax.
Here's a rundown of what I did:
- researched available import options (lottie-web, react-lottie, lottie-player, etc.)
- compared importing
lottie_lightwith our other player options & showed that the bundle size was significantly smaller (~35% smaller gzipped)
import lottieLight from "lottie-web/build/player/lottie_light";- confirmed the lottie_light player was compatible with the animations we were already shipping
So fairly basic stuff, but worth mentioning because of the impact and because it's likely the team wouldn't have figured this out otherwise since the option to use lottie_light isn't documented in their project README.
Responsive grids #
I was an Interaction Designer working on quickbooks.com as we were starting to embrace responsive design. At some point, a group of designers had been tasked to "design our responsive grid", but they pretty much started thinking about it from scratch instead of digging into how existing grid systems like Bootstrap worked.
As their efforts weren't making much headway in terms of clearly defining something that could be implemented, I started creating demos to help us along:
- codepen of a sass option for defining a grid
- video of a grid exploration with a baseline grid for vertical rhythm in addition to a responsive column grid (0:25)
Thankfully browser support for CSS grid makes all of this work unnecessary now. Still looking forward to CSS container queries though!
Working with data #
Data vis components #
This gif shows some data vis components I built with d3 and React with a focus on animations, dynamic data, and clarity. One challenge in this project was that both D3 and React want to handle the DOM, so I ended up using d3 for the math and React for the rendering.
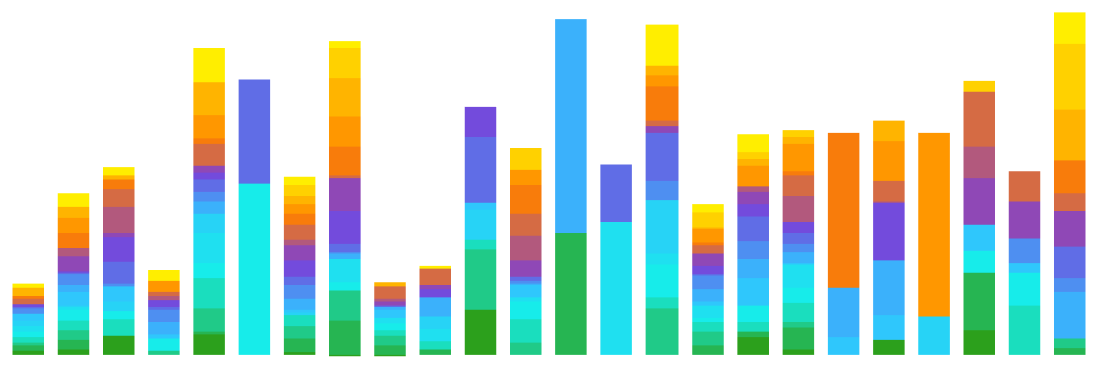
Data in color #
This codepen explored data vis colors based on our brand palettes using chroma.js – this data is fake, but these bars were for a data science hackathon where I was tasked with visualizing a similarly complex dataset in the worst-case scenario.
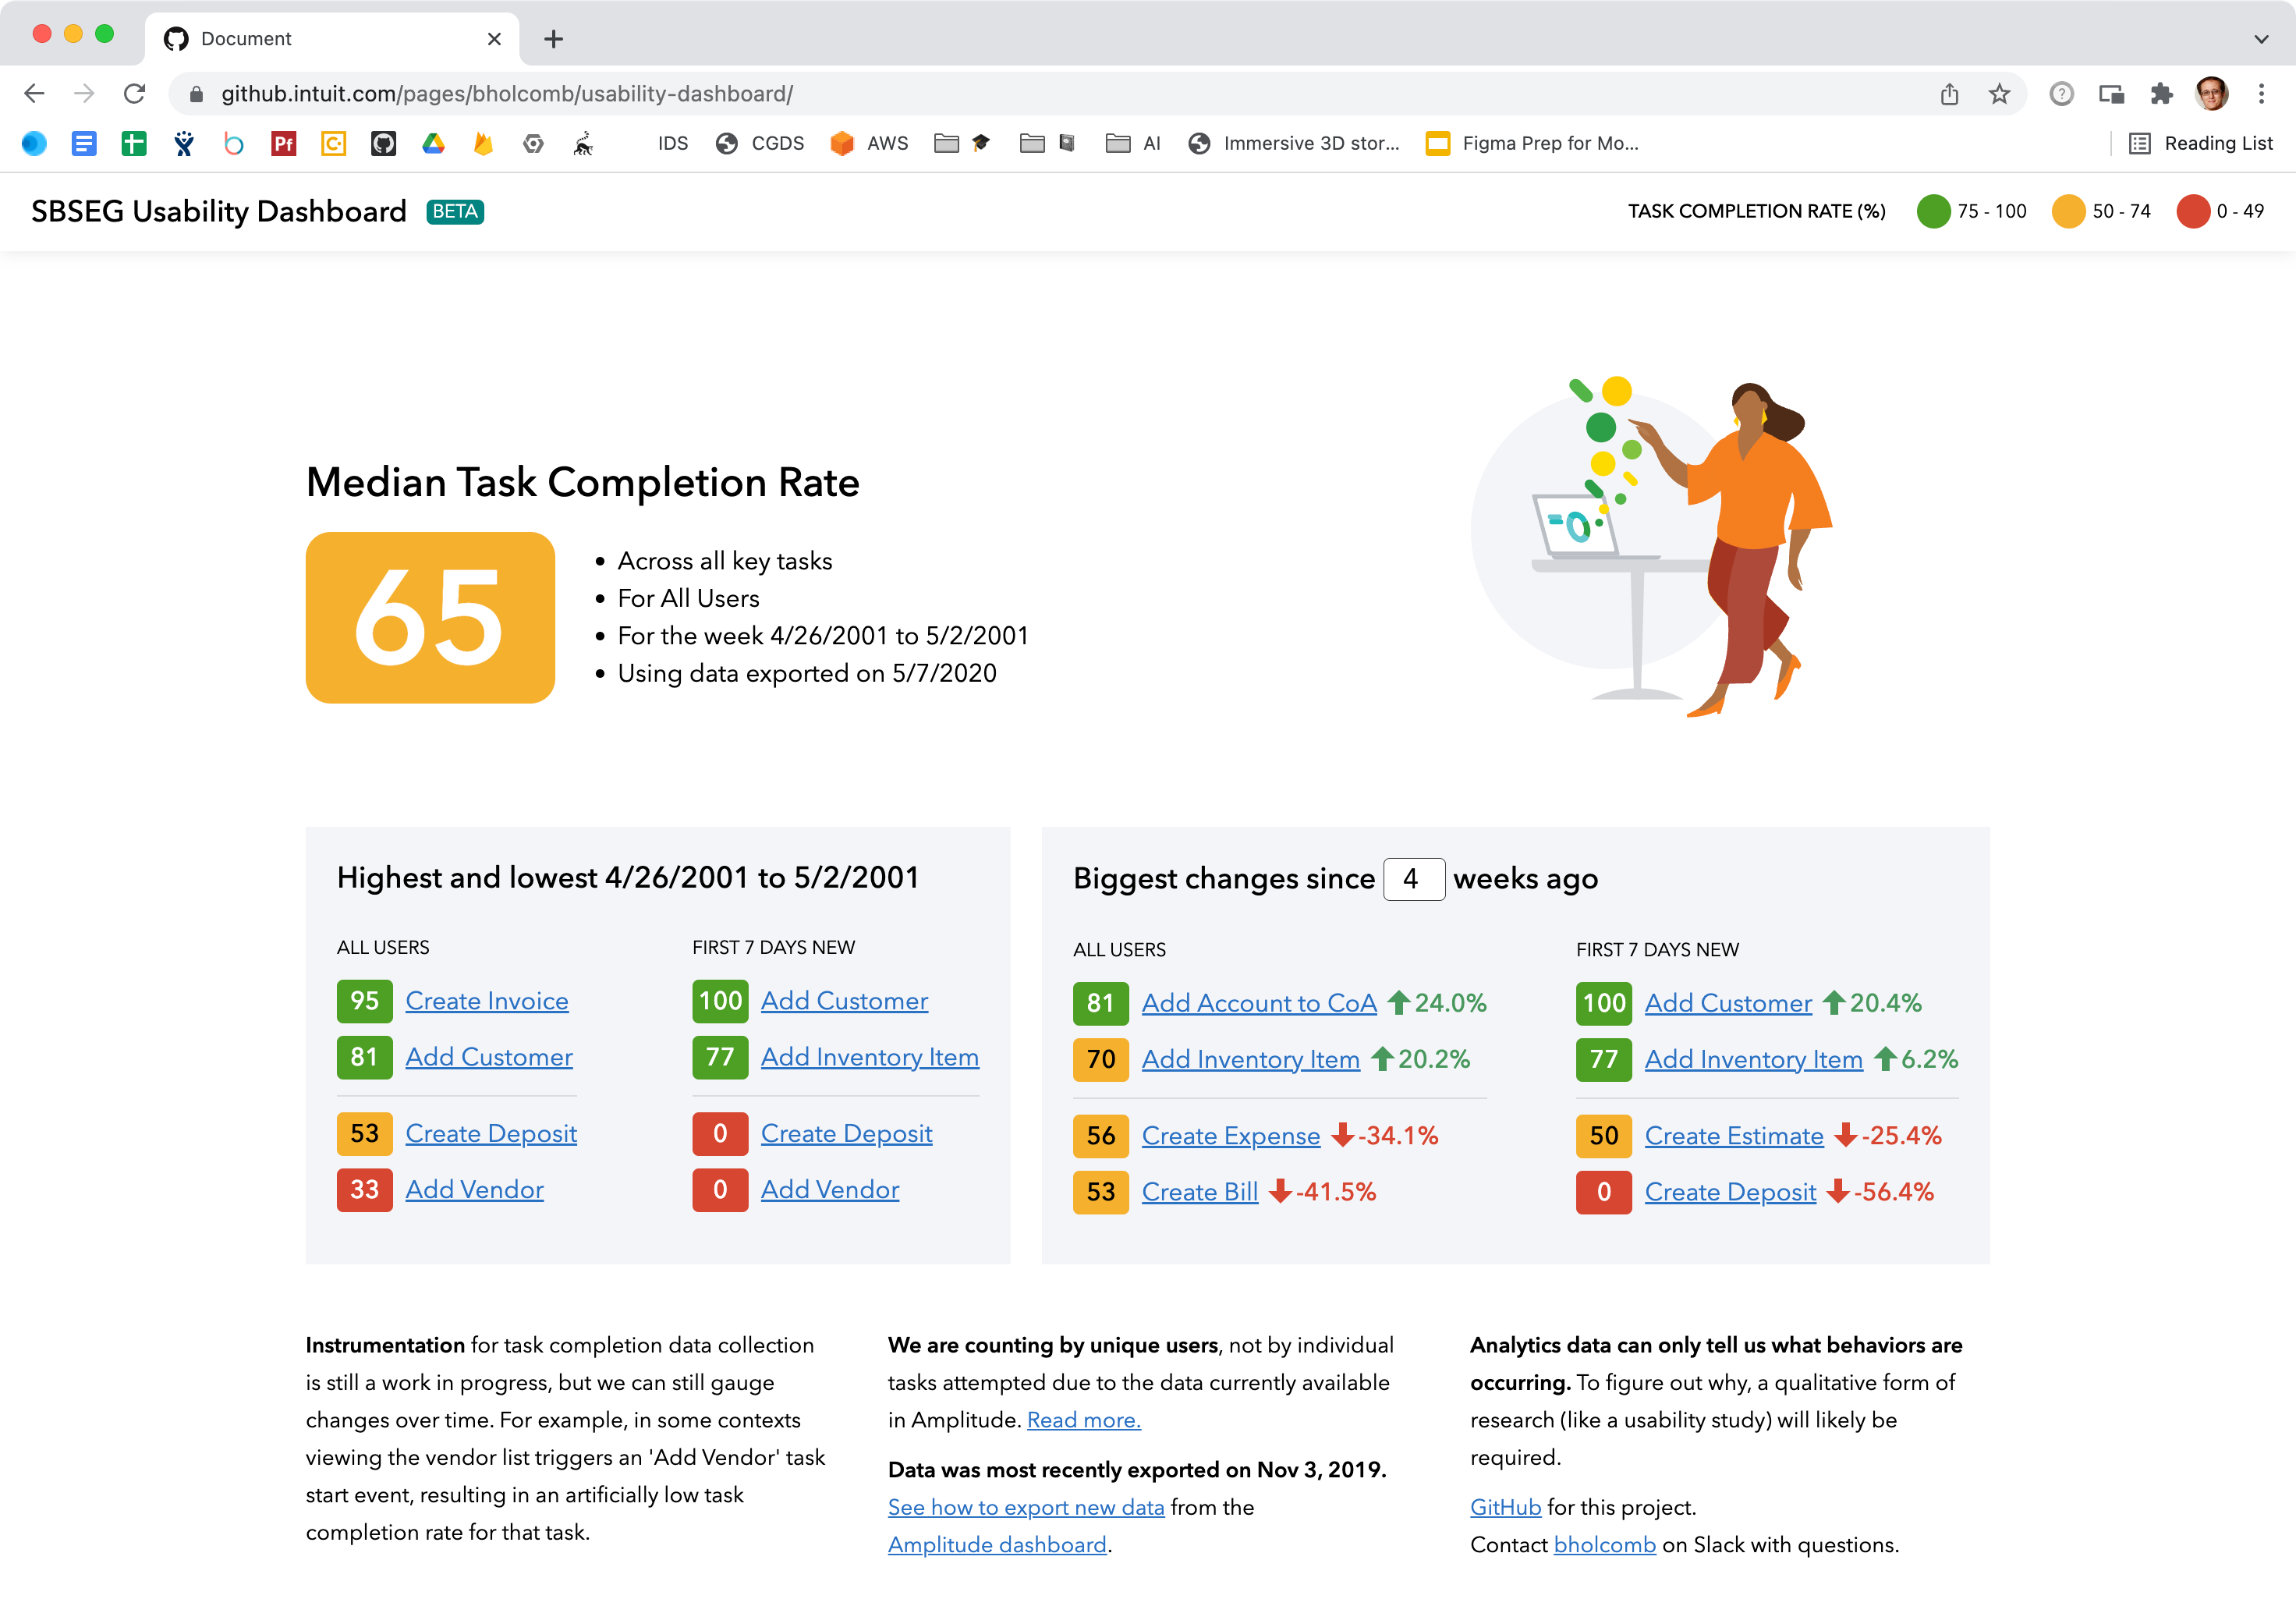
QuickBooks Usability Dashboard #
This was an attempt to create a dashboard that would give us a view into task completion rates for commons task in QuickBooks.
While the goal was admirable, this work struggled to be relevant because we didn't have consistent high-quality data. Fluctuations in the numbers were usually caused by inconsistencies in how they were collected or reported instead of actual changes in the tasks or customer behavior.
Browser size dashboard #
I built this browser size dashboard as a quick side project since this data had never been available to designers and we were still having discussions about breakpoints and "the fold" without any data to back up our hypotheses.
Project Galleries #
Our motion design team was storing their projects in Box, but it was a big headache when they were trying to share their work, show the breadth of their work, and just get people access to the files. We explored a few different options (GitHub, Adobe DAM, Google Cloud), but eventually decided to lean into their current workflow (storing working files on Box) and build a script using the Box API to identify new project folders, grab metadata stored in README files, then generate a gallery based on that data.
There were just two big hiccups in the process:
- We were never able to get the appropriate service account access to fully automate this process, so the motion team would need to ping me to run the scripts after they finished a project.
- Intuit later decided to migrate from Box to Google Drive, so we are currently revisiting the gallery and decoupling it from how project files are stored.